Lessons learned in budget projection from a volunteer organisation.
This article was also posted on LinkedIn here: https://www.linkedin.com/pulse/how-do-i-go-bankrupt-jeremy-gillbanks
Cashflow is oxygen
- Business cash flow forecasting is imperative for all entities, including not-for-profits.
- For-profit businesses can require external investment, charities require donations, and local sporting clubs require updated or new equipment for members.
- Cashflow = oxygen. Cash received at the wrong time is like not receiving cash at all.
- All organisations must receive income for the services they provide and be able to cover their suppliers’ invoices on time.
- Galvanising a workforce requires a clear understanding of where the team is today and where it could be tomorrow.
The examples in this article are from a local community sporting club in Western Australia.
When forecasting goes wrong
A typical club horror story is unexpected spending when a new treasurer is elected to a committee in which more than half of the committee members are also new. In rowing, there was a second-hand boat on sale for an excellent price of $17,000 and the club had $17,500 in its bank account.
The committee agreed the boat was within the club’s ability to purchase and a deal was made. Three weeks later, an unexpected bill of $1,000 came due for old race fees and fines. With new memberships not due for another four months, the club faced an overdraft accruing bank fees because of the large and unexpected purchase of the second-hand boat. No one had looked at the previous account statements or outstanding invoices to ensure that nothing obvious was coming due. No one had accounted for a financial buffer in case something went wrong. There was no handover between treasurers and the importance of governance or forward planning despite the laudable goal of turning over assets.
How was this solved? After some begging, one of the squads with members who were over the age of 40 paid their fees four years in advance. The club then had the cash flow to not require the overdraft.
For recreational sporting clubs, understanding the timing of future cash flows allows for:
- Comparison of fixed and variable costs
- Asset turnover prediction
- Painting a vision of the future
- A rallying cry for members to recruit more friends, or
- Additional fundraising opportunities (e.g., grants, sponsorships, sausage sizzles)
During COVID-19, up to 24,000 community sporting clubs in Australia faced financial stress [1]. Forecasting also affects large sporting clubs. The Barcelona Football Club is also facing significant financial difficulty due to both COVID-19 and paying Lionel Messi’s salary despite its status as a billion-dollar club [2].
The story so far, understanding past spending
The first, and least interesting or compelling, step for volunteers is poring over bank statements. A committee member, usually the treasurer, must acquire at least the previous two years (or seasons) of bank statements so that a steady-state can be attained. As a rule of thumb, five years is preferred.
For the COVID-19 period, a reasonable argument can be made that February 2020 – February 2021 was an abnormal period with abnormal spending. Therefore, bank statements must go back even further.
Once the bank statements have been attained, a Chart of Accounts should be created. More detail is generally better than big buckets, of which it is easy to lose track. A good overview is available here:
http://www.leoisaac.com/fin/fin017.htm
A reference to the required standard from the Australian Charities and Not-for-Profits Commission (ACNC) is here:
https://www.acnc.gov.au/for-charities/manage-your-charity/national-standard-chart-accounts.
However, the Chart of Accounts will vary between sports. I have found that the most effective Chart of Accounts is one that new treasurers find intuitive to use. Therefore, you must edit them to better suit your club. For example, if your club does not have a canteen, then remove “Canteen Purchases” from your Cost of Sales.
It took me over 12 months to truly understand my club’s finances. This was despite having already been on the committee for three years and the fact that previous committees had created a Chart of Accounts. Rebuilding the budget with the Chart of Accounts into my own spreadsheet was the only activity that led me to understand the budget. When moving line items around, placing the income line item (e.g., membership income) alongside the expense line item (e.g., coaching) allowed me to better visualise the flow of funds. The typical accounting presentation of a Profit and Loss statement collects the income line items together and separates them from a collected set of expense line items. With a large Chart of Accounts, it was easy to forget why certain expenses existed (because they were not obviously tied to an income) or to believe that the club was highly profitable (because an income item had not been linked to a corresponding expense).
How do I get members to care?
Typical presentations to for-profit company shareholders and club members alike are usually a long list of ambiguous account names and corresponding values. For sporting clubs in particular, a line item of $250 (e.g., oar repair) can be next to a much larger line item of $25,000 (e.g., boat purchase). This is particularly pernicious when a committee spends over 30 minutes debating whether to reduce oar repair to $220 in future years, but comparatively little time on the value of a new boat purchase.
Where are the funds going right now?
The solution I have found is to create a stacked column graph of previous and current expenses and income.
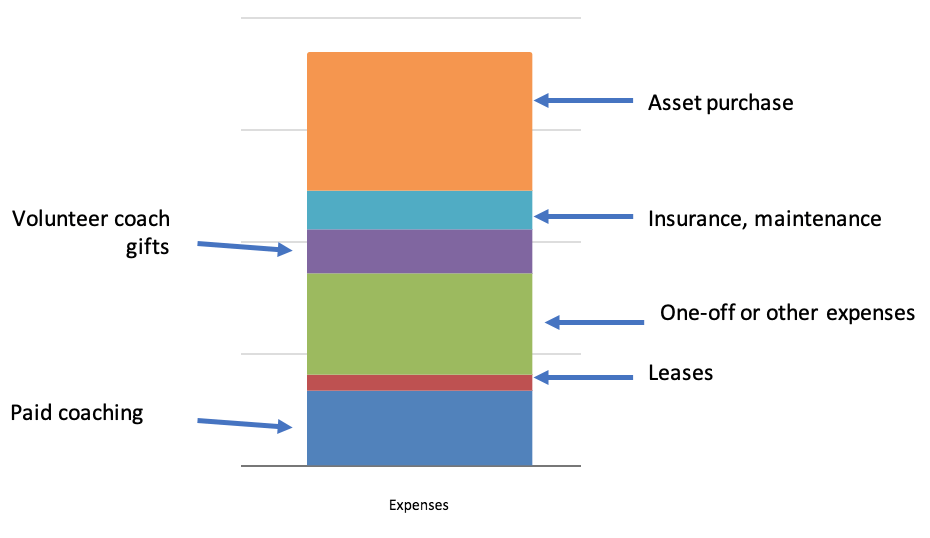
Figure 1: A stacked column graph of club expenses with values removed for confidentiality.
The graph above compares fixed and variable costs and the effect of asset turnover on the rest of the club’s spending. Finally, it helps to prioritise budget discussions about the things that are big-ticket items as compared to those that are comparatively small. It also highlights when items for purchase are within our control (e.g., new assets or coaching) and when they are not (e.g., insurance). Additionally, when the same graph is constructed for income, the business’s financial position can be immediately shown as dependent on members, sponsors, grants, or a mix of sources.
Once the current year has been budgeted, it is very easy to copy the column across five spaces in Excel. Immediately, you have a five-year forecast. Furthermore, members can be shown which future asset purchases can (or cannot) be covered by expected income.
What does it mean for us in the future?
With the five-year forecast created, experienced committee members can input where large incomes or expenses are anticipated.
During COVID-19, the rowing club observed a significant decrease in members – up to 50% in some squads. This significantly impacted our cash flow and reduced our ability to fund asset turnover and coaching. At the following Annual General Meeting, I presented two future visions of the club:
- Post-COVID: No recruitment drive. Our membership numbers remain at their lower 2020 levels for the foreseeable future. Fewer members leads to reduced revenue and diminished capacity to fund our rowing programs.
- Pre-COVID: Big recruitment drive. Our membership numbers return to their pre-COVID levels. Our increased membership from the 2020 levels leads to increased revenue and a return to full rowing program capacity.
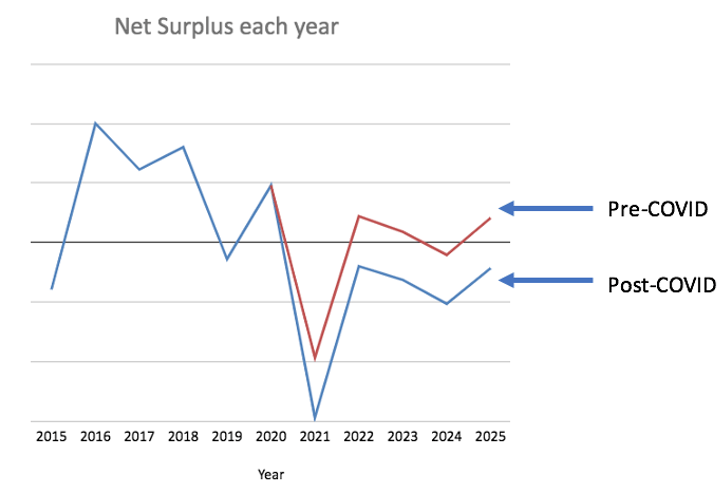
Figure 2: Example forecast with the effect of different membership numbers due to COVID-19. The 2021 decrease was due to asset purchases and the y-axis values are removed for confidentiality.
“But what do we have to do right now?”
February 2021 was our opportunity to recruit new members, and the 2020 membership rallied around this vision. It answered the question, “What do I have to do right now?” With a shared purpose, the members encouraged each other to recruit, which led to an influx of new members. Over 50 new members were recruited in the first week alone, and the remainder of the first month saw more members join the sport.
Ultimately, the financial projection painted a picture of what the members had to do and they responded by actively recruiting new members.
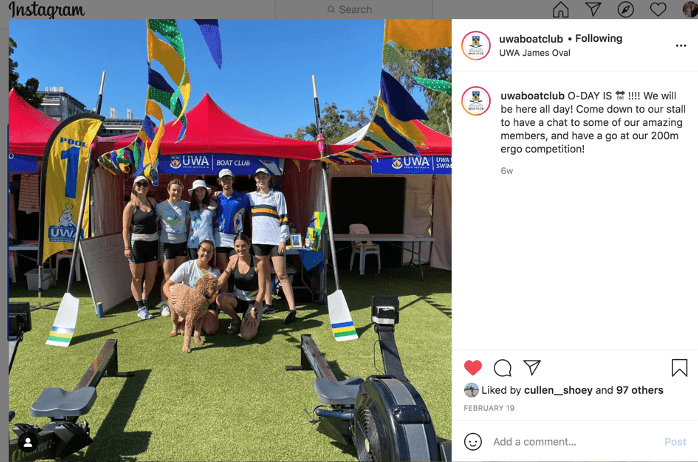
Figure 3: Social media from the recruitment event that targeted new university students.
Conclusion
Forecasting can be difficult for organisations that have not previously predicted future cash flows. Not-for-profits are no exception. Galvanising a workforce, whether volunteer or paid, requires a clear understanding of where the team is today and where it could be tomorrow – both the best and worst cases. Forecasting is one aspect of uniting a team and building a vision for a shared future that must be completed.
Finally, when presenting to an oversight board, the simple graphs shown above allow for obvious and detailed insight with few words. A one-page summary naturally follows, which allows all board members to clearly see detail in its appropriate context.
References
1. Joyner, T. and L. Kewley Community clubs facing financial ruin as coronavirus restrictions bite. ABC News, 2020. https://www.abc.net.au/news/2020-06-12/24000-community-sport-clubs-might-not-survive-covid19-pandemic/12344156
2. Panja, T. and R. Smith Barcelona and the Crippling Cost of Success. The New York Times, 2021. https://www.nytimes.com/2021/02/12/sports/soccer/barcelona-messi-contract.html